


The inventory turnover ratio tells you how many times a business sells through its stock in a period. It is one of the simplest ratios in accounting and one of the easiest to get wrong, because the answer changes with how you measure average inventory.
This guide gives you the formula, a free calculator, real figures from Costco, Walmart and Home Depot, US industry benchmarks from the Census Bureau, and the results of a test where we asked ChatGPT and Claude to analyze the same inventory data. Every figure here traces to a named source or to a calculation you can check.
What is the inventory turnover ratio?
It measures how many times a business sells and replaces its inventory during a period. It equals cost of goods sold divided by average inventory. A ratio of 6 means the business sold through its average stock six times in the year, or roughly every 61 days.
Inventory turnover = Cost of goods sold ÷ Average inventory
Average inventory = (Beginning inventory + Ending inventory) ÷ 2
Use the calculator below with figures from your income statement and balance sheet. It also gives you days inventory outstanding, which turns the ratio into the number of days stock sits on the shelf.
Inventory turnover ratio calculator
Enter figures from your income statement and balance sheet in any currency.
Formula: inventory turnover = COGS ÷ average inventory, where average inventory = (beginning + ending) ÷ 2. Days inventory outstanding = days in the period ÷ turnover, using 365, 90 or 30 days.
How do you calculate inventory turnover ratio?
Take cost of goods sold for the period, work out average inventory, then divide the first by the second. To convert the result into days, divide the days in the period by the turnover. For a seasonal business, average more than two inventory balances, or the ratio will look better than reality.
- Find cost of goods sold (COGS) for the period on the income statement. Retailers sometimes call it cost of sales or merchandise costs.
- Find beginning and ending inventory on the balance sheet for the same period.
- Calculate average inventory. The simple version adds beginning and ending inventory and divides by 2.
- Divide COGS by average inventory. The result is your turnover.
- Convert to days if useful. Days inventory outstanding (DIO) equals 365 divided by the annual turnover.
What is the inventory turnover ratio formula?
| Measure | Formula |
|---|---|
| Inventory turnover | COGS ÷ Average inventory |
| Average inventory, simple | (Beginning inventory + Ending inventory) ÷ 2 |
| Average inventory, 13 point | (Opening inventory + 12 month end balances) ÷ 13 |
| Days inventory outstanding | 365 ÷ Inventory turnover |
| Annualized turnover for a quarter | Quarterly turnover × 4 |
Why use COGS and not sales?
Inventory sits on the balance sheet at cost, and COGS is also measured at cost, so the two match. Sales include your profit margin. Dividing sales by inventory therefore mixes selling prices with cost prices and inflates the ratio. Some data providers use sales because COGS is not always published, which is fine for comparison only if you know which method you are looking at.
The gap between cost and selling price is your markup. If you want to see exactly how much of each sale is profit, our free markup calculator shows your markup percentage and gross margin side by side.
Inventory turnover examples: a small business and three big retailers
A small retailer with COGS of 480,000 and inventory of 70,000 at the start and 90,000 at the end of the year turns its stock 6.0 times, about every 61 days. Among big US retailers, Costco turned inventory about 14 times in its latest fiscal year, Walmart about 9 times and Home Depot about 4.5 times.
A simple small business example
| Step | Calculation | Result |
|---|---|---|
| Average inventory | (70,000 + 90,000) ÷ 2 | 80,000 |
| Inventory turnover | 480,000 ÷ 80,000 | 6.0 times |
| Days inventory outstanding | 365 ÷ 6.0 | About 61 days |
Illustrative figures, the same ones the calculator uses for its example.
Real company examples from SEC filings
| Company | Fiscal year | COGS ($m) | Opening inventory ($m) | Closing inventory ($m) | Turnover | Days |
|---|---|---|---|---|---|---|
| Costco | 52 weeks to Aug 30, 2026 | 264,279 | 18,116 | 19,324 | 14.12 | 25.9 |
| Walmart | Year to Jan 31, 2026 | 535,395 | 56,435 | 58,851 | 9.29 | 39.3 |
| Home Depot | 52 weeks to Feb 1, 2026 | 109,818 | 23,451 | 25,817 | 4.46 | 81.9 |
COGS and inventory figures from Costco’s fiscal 2026 results, Walmart’s Q4 FY26 earnings release and Home Depot’s Q4 fiscal 2025 results. Turnover and days are our calculation using a simple average and 365 days.
The spread tells the story. Costco is a high volume warehouse club selling everyday goods, and its stock clears in under a month. Home Depot carries lumber, tools and appliances that sell more slowly, so the same dollar of inventory sits for nearly three months. Neither is wrong. They are different businesses.
If you track these figures across several years, measure the trend with one number. Our free growth rate calculator shows the yearly growth rate of revenue or cost of goods sold between any two years.
What is a good inventory turnover ratio?
A good turnover ratio depends on your industry. US Census Bureau data for August 2026 implies roughly 15 turns a year for food and beverage stores, about 6 to 7 for furniture and electronics stores, about 6 for clothing stores, and under 5 for building materials and department stores. The best comparison is your own trend over time.
The Census Bureau publishes inventories to sales ratios every month in its Manufacturing and Trade Inventories and Sales report. The ratio is month end inventory divided by that month’s sales, so 12 divided by the ratio gives a rough annual turnover.
| Industry | Census inventories to sales ratio, Aug 2026 | Approximate annual turnover | Approximate days |
|---|---|---|---|
| Food and beverage stores | 0.82 | 14.6 | 25 |
| Merchant wholesalers | 1.18 | 10.2 | 36 |
| General merchandise stores | 1.39 | 8.6 | 42 |
| Manufacturers | 1.48 | 8.1 | 45 |
| Furniture, home furnishings, electronics and appliance stores | 1.80 | 6.7 | 55 |
| Motor vehicle and parts dealers | 1.98 | 6.1 | 60 |
| Clothing and clothing accessories stores | 2.02 | 5.9 | 61 |
| Building materials, garden equipment and supplies dealers | 2.53 | 4.7 | 77 |
| Department stores | 2.60 | 4.6 | 79 |
Ratios from the Census Bureau MTIS release, seasonally adjusted, August 2026 preliminary, released October 15, 2026. Turnover (12 ÷ ratio) and days (365 ÷ turnover) are our calculation.
Read this table with three cautions. First, it is sales based, so a COGS based turnover for the same business will be lower. Second, it averages very different companies, from small shops to national chains. Third, it covers the US only and one month of data. Use it to see whether you are in a sensible range, not as a target to hit.
The real company figures line up with it. Costco turned stock 14 times, in the range of the fastest categories. Home Depot, a building materials retailer, turned it about 4.5 times, close to the Census figure for that category.
What does a high or low inventory turnover tell you?
The ratio tells you how efficiently stock turns into sales. A higher ratio usually means stock sells quickly and less cash is tied up in the warehouse. A lower ratio can signal overbuying, slow lines or obsolete stock. Very high turnover can also mean you carry too little and lose sales to stockouts.
| Result | What it can mean | What to check |
|---|---|---|
| Rising turnover | Stock sells faster, less cash tied up | Whether stockouts or lost sales are rising too |
| Falling turnover | Buying ahead of demand, slow or obsolete lines | Aged stock reports and purchase orders |
| Very high turnover | Lean stock, or not enough of it | Out of stock rates and customer complaints |
| Very low turnover | Overstocking, dead stock risk | Write-downs and items with no sales in 90 days |
For a small business, the cash effect is the practical point. If annual COGS is 480,000, every 10 days of extra inventory holds roughly 13,000 of cash (480,000 ÷ 365 × 10). That is money not available for payroll, marketing or debt.
How can a small business improve inventory turnover?
Improve turnover by buying closer to real demand, clearing slow stock early, and measuring the ratio monthly instead of once a year. The goal is not the highest possible number. It is a level that keeps best sellers in stock while freeing cash from items that are not moving.
- Review sell through by product every month. One slow category can drag the whole ratio down.
- Tie purchase orders to recent sales, not to last year’s guess, especially before a seasonal peak.
- Mark down slow movers early. A discount in month three usually beats a write-off in month twelve.
- Negotiate smaller, more frequent deliveries with key suppliers where the cost difference is small.
- Set a minimum stock level for best sellers, so improving turnover never means running out of what customers want.
- Track days inventory outstanding monthly, so a stock build shows up while you can still act.
What mistakes do people make with inventory turnover?
The most common mistakes are using sales instead of COGS, averaging only the opening and closing balances in a seasonal business, mixing a quarter’s COGS with an annual inventory figure, and comparing companies in different industries. In our sample data, the two point average overstated turnover by about 24 percent.
1. Using sales instead of COGS. In our test data below, sales were 1.65 times COGS, so a sales based ratio came out 1.65 times higher than the correct one.
2. Averaging only two balances in a seasonal business. If stock is low at both year ends but builds up before a peak season, a simple average misses the build. Our sample retailer showed a turnover of 9.24 on a simple average and 7.46 on a 13 point average. The simple method made inventory management look about 24 percent better than it was.
3. Mixing periods. Quarterly COGS divided by average annual inventory gives a quarterly turnover. Multiply by 4 if you want an annual rate, and say that you did.
4. Ignoring write-downs. Under IAS 2 Inventories, inventories are measured at the lower of cost and net realisable value, and write-downs are recognised as an expense in the period they occur. If that expense sits in COGS, it lifts turnover slightly. Show it separately so a write-off does not look like efficient selling.
5. Comparing across industries or cost formulas. A grocer and a furniture store will never have similar ratios. Companies also use different cost formulas, such as first in, first out or weighted average, which change reported inventory and COGS. Compare like with like.
Can ChatGPT and Claude calculate inventory turnover correctly?
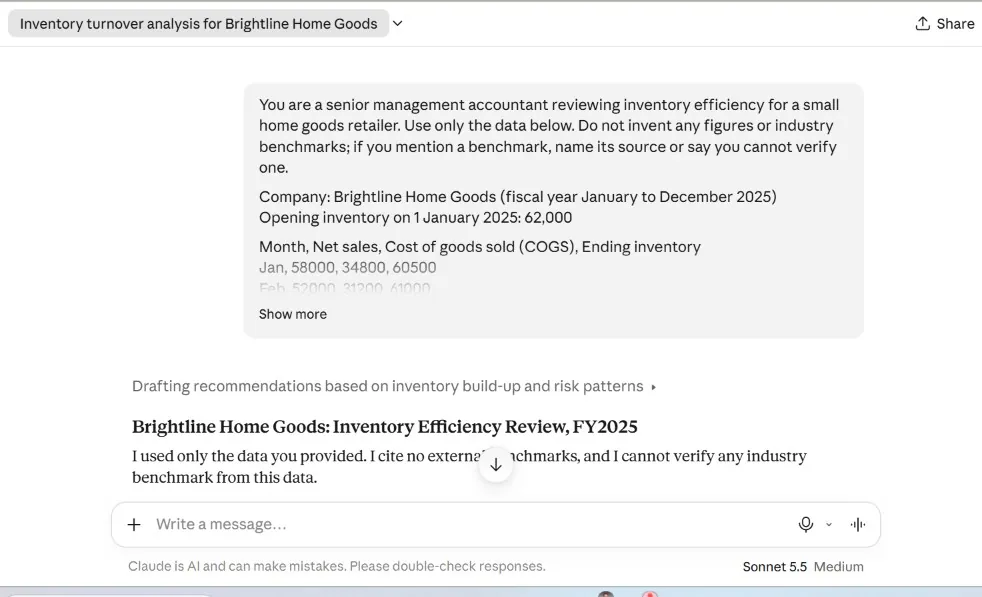
Yes. In our test, the free versions of ChatGPT and Claude both got every figure right on the same 12 month dataset, including the 13 point average, quarterly results and a write-down adjustment. They differed in style: ChatGPT was more thorough on accounting detail, while Claude was shorter and more practical.
How we tested
On October 25, 2026, we gave both tools one identical prompt in a new chat, with no follow up questions. The prompt contained 12 months of sales, COGS and inventory for a fictional home goods retailer, plus three deliberate traps: a seasonal stock build that distorts the simple average, a request to compare sales based turnover, and a 6,000 obsolete stock write-down inside December COGS. It also told both models not to invent industry benchmarks.
| Detail | ChatGPT | Claude |
|---|---|---|
| Plan | Free | Free |
| Model shown | Not shown on screen | Sonnet 5.5, Medium effort |
| What it showed | Three “Analyzed” steps, “Worked for 32s” | A short drafting step, then the answer |
| Length of answer | About 660 lines | About 70 lines |

Results against our answer key
| Check | Correct answer | ChatGPT | Claude |
|---|---|---|---|
| Turnover, simple average | 9.24 | Correct | Correct |
| Turnover, 13 point average | 7.46 | Correct | Correct |
| Days, 13 point average | 48.9 | Correct | Correct |
| Sales based turnover, 13 point | 12.31 | Correct | Correct |
| Turnover excluding write-down | 7.38 | Correct | Correct |
| Quarterly annualized turnover | 6.65, 7.10, 5.97, 9.50 | Correct | Correct |
| Slowest quarter | Q3 | Correct | Correct |
| Invented a benchmark | Should not | Did not | Did not |
Where they differed
ChatGPT handled the accounting detail best. It noted that if the write-down had already reduced closing inventory, removing it from COGS alone is only a partial adjustment, then calculated a fully adjusted version and labeled the assumption clearly. It also warned that Q4’s strong turnover came partly from the holiday sell down and the write-down, not necessarily better stock control. The downside was length: the answer ran to roughly 660 lines with formulas in a format that does not display well everywhere.
Claude was faster to act on. It expressed the simple average gap as a percentage (the two point average was 19 percent below the 13 point average), showed that sales were 1.65 times COGS, and turned the numbers into specific warnings. October stock covered about 73 days of October COGS, while December closing stock covered only about 19 days, a possible stockout risk for January. Its one slip was stating as fact that closing inventory was already net of the write-down, which the data did not say.
Our verdict
Both tools were fully accurate, so choose by how you will use the answer. ChatGPT suits an accountant reviewing the logic step by step. Claude suits a business owner who wants a short list of actions. The bigger lesson is that both got it right because the prompt named the method. Ask a vague question and either tool may default to the simple average, which in this data overstates turnover by about 24 percent.
Here is the prompt we used, so you can run it on your own figures. Replace the company name and data, and keep the method instructions.
You are a senior management accountant reviewing inventory efficiency for a small retailer. Use only the data below. Do not invent any figures or industry benchmarks; if you mention a benchmark, name its source or say you cannot verify one.

[Paste your opening inventory and a table of Month, Net sales, COGS, Ending inventory]
[Note any write-downs or unusual items]

Tasks:
1. Calculate annual inventory turnover and days inventory outstanding using the simple average of opening and closing inventory.
2. Recalculate both using the average of all 13 inventory balances. Explain why the results differ and which better represents this business.
3. Recalculate using net sales instead of COGS and explain why that overstates turnover.
4. Show the impact of excluding any write-down and say whether it should be excluded when assessing operating efficiency.
5. Calculate and annualize turnover for each quarter, and identify the slowest quarter.
6. Give three practical, specific recommendations based on the numbers.

Show every formula and intermediate figure, round ratios to two decimals and days to one decimal, use 365 days, and present results in tables.
For a wider comparison of the two tools on finance work, see our guide to ChatGPT vs Claude for accountants, and for more ready to use prompts, our ChatGPT prompts for accountants. Inventory turnover is also a standard month end check, and our Claude prompts for month end close and FP&A show how to build it into a full close and variance review.
How do you calculate inventory turnover in Excel and Power BI?
In Excel, divide total COGS by the average of your inventory balances, for example =SUM(COGS range)/AVERAGE(inventory range) for a 13 point average. Our free Excel calculator does this for you, with monthly tracking, quarterly results and a chart. In Power BI, divide a COGS measure by an average inventory measure.
The free Excel calculator
The workbook has four sheets:
- Calculator: enter COGS, beginning and ending inventory, and the period. It returns turnover, days inventory outstanding and annualized turnover.
- Monthly Tracker: enter 12 months of COGS and inventory. It shows monthly turnover and days, compares the simple and 13 point methods, flags how much the simple method overstates turnover, finds the slowest quarter and charts days inventory outstanding.
- Industry Benchmarks: the Census figures above, with the conversion formulas.
- Company Examples: Costco, Walmart and Home Depot, with the source for every number.
Key formulas if you build your own:
| Result | Excel formula (example cell ranges) |
|---|---|
| Annual COGS | =SUM(C8:C19) |
| Simple average inventory | =(C4+E19)/2 |
| 13 point average inventory | =AVERAGE(C4,E8:E19) |
| Inventory turnover | =C20/C25 |
| Days inventory outstanding | =365/D25 |
A Power BI pattern
If your model has a COGS table, an inventory balance table and a date table, this pattern returns turnover and days. Adapt the table and column names to your model, and note that it averages month end balances, so it does not include the opening balance.
Total COGS = SUM ( Sales[COGS] )

Closing Inventory =
CALCULATE ( SUM ( Inventory[Value] ), LASTDATE ( 'Date'[Date] ) )

Average Inventory =
AVERAGEX ( VALUES ( 'Date'[Year Month] ), [Closing Inventory] )

Inventory Turnover = DIVIDE ( [Total COGS], [Average Inventory] )

Days Inventory Outstanding = DIVIDE ( 365, [Inventory Turnover] )
If you analyze stock in Excel with AI help, our guides to Claude for Excel for accountants and the best AI for Excel VBA macros show what works and where to double check.
Frequently asked questions
What is a healthy inventory turnover for my industry?
It depends on the industry. US Census Bureau data for August 2026 implies about 15 turns a year for food and beverage stores, around 6 to 7 for furniture and electronics stores, about 6 for clothing stores, and under 5 for building materials and department stores. Those figures are sales based, so compare your COGS based ratio with care.
How do you work out inventory turnover step by step?
Divide cost of goods sold for the period by average inventory. Average inventory is beginning plus ending inventory divided by 2, or the average of all month end balances for a seasonal business. For example, COGS of 480,000 and average inventory of 80,000 give a turnover of 6.0.
What does inventory turnover ratio tell you?
It shows how quickly a business sells through its stock. A higher ratio usually means faster selling and less cash tied up in inventory. A falling ratio can point to overbuying or slow moving stock, while a very high ratio can mean the business carries too little and risks stockouts.
Is a higher inventory turnover always better?
No. Higher turnover usually means less cash tied up, but if it comes from carrying too little stock, you may lose sales when best sellers run out. Look at turnover together with stockouts, gross margin and customer demand. The right level keeps popular items available while slow items do not pile up.
What is the difference between inventory turnover and days inventory outstanding?
They measure the same thing in different units. Inventory turnover counts how many times stock sells through in a period. Days inventory outstanding converts that into days by dividing 365 by the annual turnover. A turnover of 6.0 equals about 61 days, which many owners find easier to act on.
Can I use sales instead of cost of goods sold?
You can, but it overstates turnover because sales include your profit margin while inventory is held at cost. In our test data, sales were 1.65 times COGS, so the sales based ratio was 1.65 times higher. Use COGS for your own analysis, and only compare against sales based figures when you know the method.
How often should I calculate inventory turnover?
Monthly is best for most small businesses, with an annual figure built from the monthly balances. Monthly tracking shows a stock build while you can still act on it. A single year end calculation can hide seasonal swings, as our sample retailer showed when its simple average overstated turnover by about 24 percent.
The bottom line on inventory turnover
The inventory turnover ratio is COGS divided by average inventory, and the method you choose for average inventory matters as much as the formula. Use COGS, average more than two balances if your business is seasonal, and compare with your own history first and your industry second.
Run your figures through the calculator above, download the Excel workbook to track the ratio monthly, and if you use AI to analyze stock, give it the method in the prompt. For more practical finance guides, browse Business and AI, or see how AI tools handle the books in our review of the best AI bookkeeping agents for small business.